A clinically engineered, 16-point recovery protocol tailored specifically for your 1.7 mg/dL reading. No report upload needed. Immediate instant access.
Creatinine
1.7 mg/dL
Not added
Not added
No generic advice or vague warnings. Each section is custom generated based on your exact Creatinine reading of 1.7 mg/dL.
Specific actions to implement within the next 24 to 48 hours to halt progression.
The 1-month, 3-month, 6-month, and 1-year progressive physiological risks.
Exact confirmatory tests & optimal retest timing.
Foods to strictly eliminate, restorative superfoods, hydration volume, and exercise limits.
Word-for-word questions to ask your physician and exact clinical flags to raise.
Standard reference ranges explained and where your 1.7 mg/dL precisely sits.
Categorized risk classification.
Clinically researched compounds, exact dosages, and medications physicians evaluate.
Common OTC pain meds (NSAIDs like ibuprofen) and prescriptions that dangerously elevate levels.
Expected physiological recovery milestones across 2 weeks, 1 month, 3 months, and 6 months.
Clear symptoms separating what is routine from what warrants an immediate ER visit.
Weekly structured scorecards to log fatigue, physical recovery, and biomarker normalization.
Direct answers to the top anxieties patients face after seeing a 1.7 mg/dL result.
Comprehensive investigation of primary, secondary, and overlooked environmental root causes.
Clinical triggers where medical therapeutics and specialist interventions become mandatory.
Maintenance lifestyle protocols to permanently keep your markers in the optimal zone.
Formulated for: Creatinine (1.7 mg/dL)
One-time payment · Instant generation · No subscription
Our clinical analysis system will cross-reference your specific medications against Creatinine to check for drug-induced influences.
Mapped to your numbers, your symptoms, and your medications.
Which markers are mildly abnormal vs severely dangerous.
Which tests you actually need, why, and when.
Foods to eat and foods to avoid for your specific results.
Exactly when to repeat each test to track progress.
What may bring your abnormal results back toward normal.
Critical list of drugs to avoid with your specific markers.
Natural steps you can start today.
The critical questions most patients forget to ask.
A lab flags each value as high or low on its own. Clinical medicine doesn't work that way. Your analysis reads markers together, as ratios, indices and organ-system patterns, the same way a specialist reads a chart.
Where each value sits inside its range, because a ferritin of 18 and one of 180 are both "normal" but mean very different things.
Validated clinical calculations such as AST/ALT, BUN/creatinine, TG/HDL and FIB-4, which no single marker can show.
Markers grouped by physiology (hepatic, renal, hematologic, endocrine) to separate a true pattern from an isolated blip.
Results weighed against your age, symptoms and medications, including drug-induced and assay-interference effects.
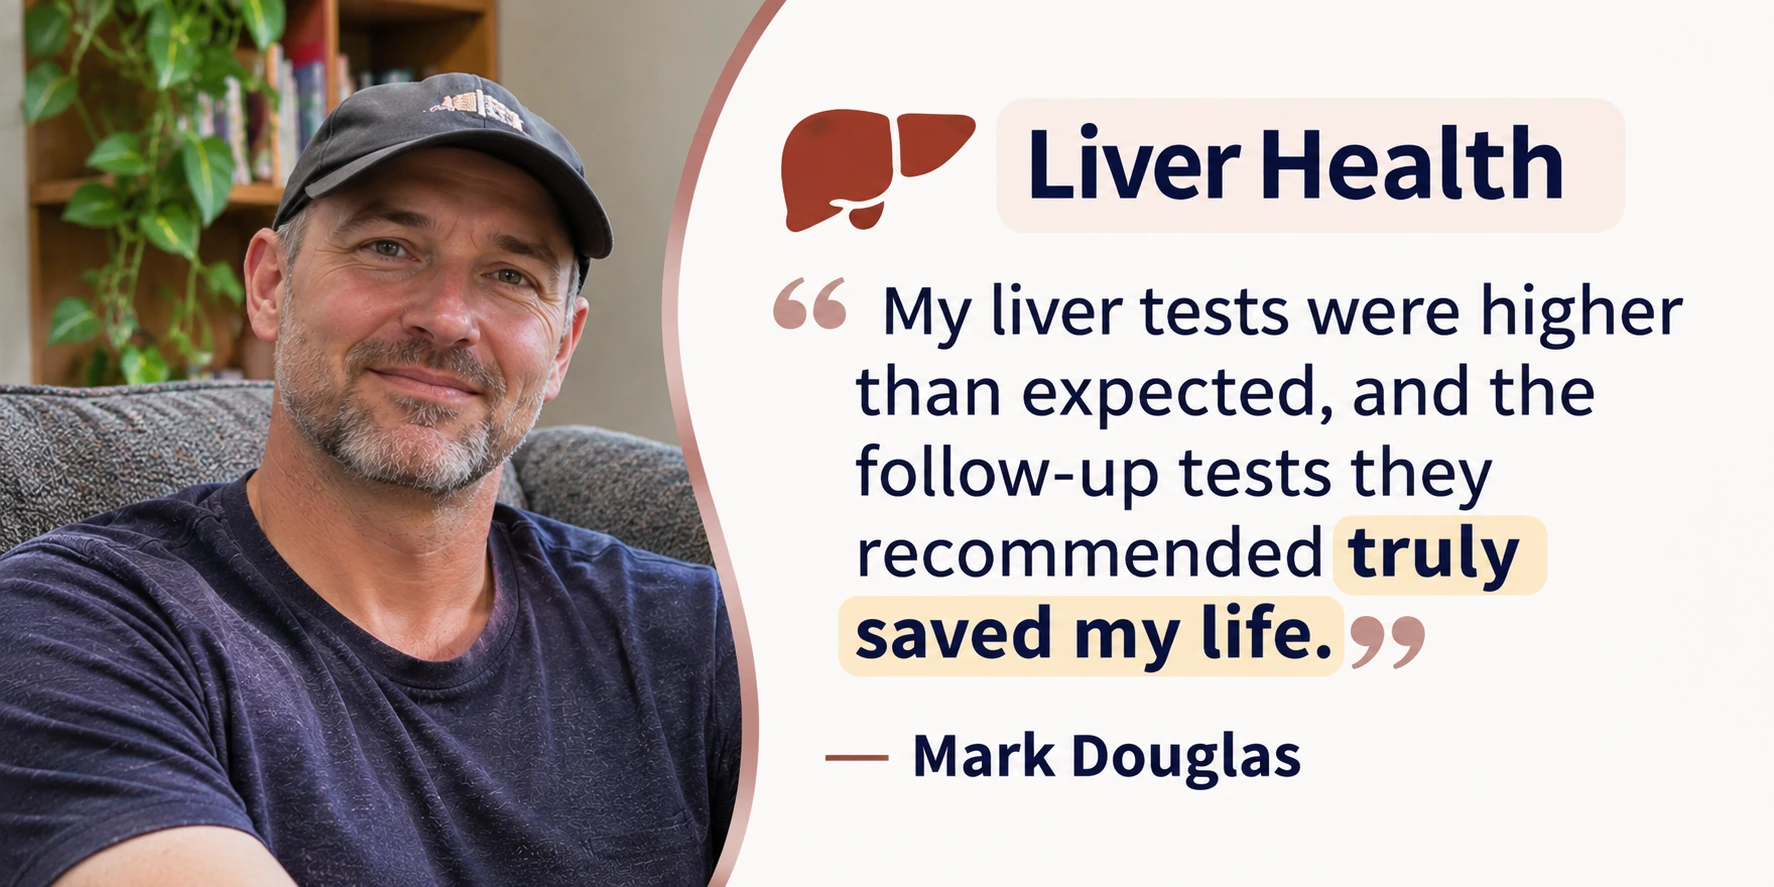
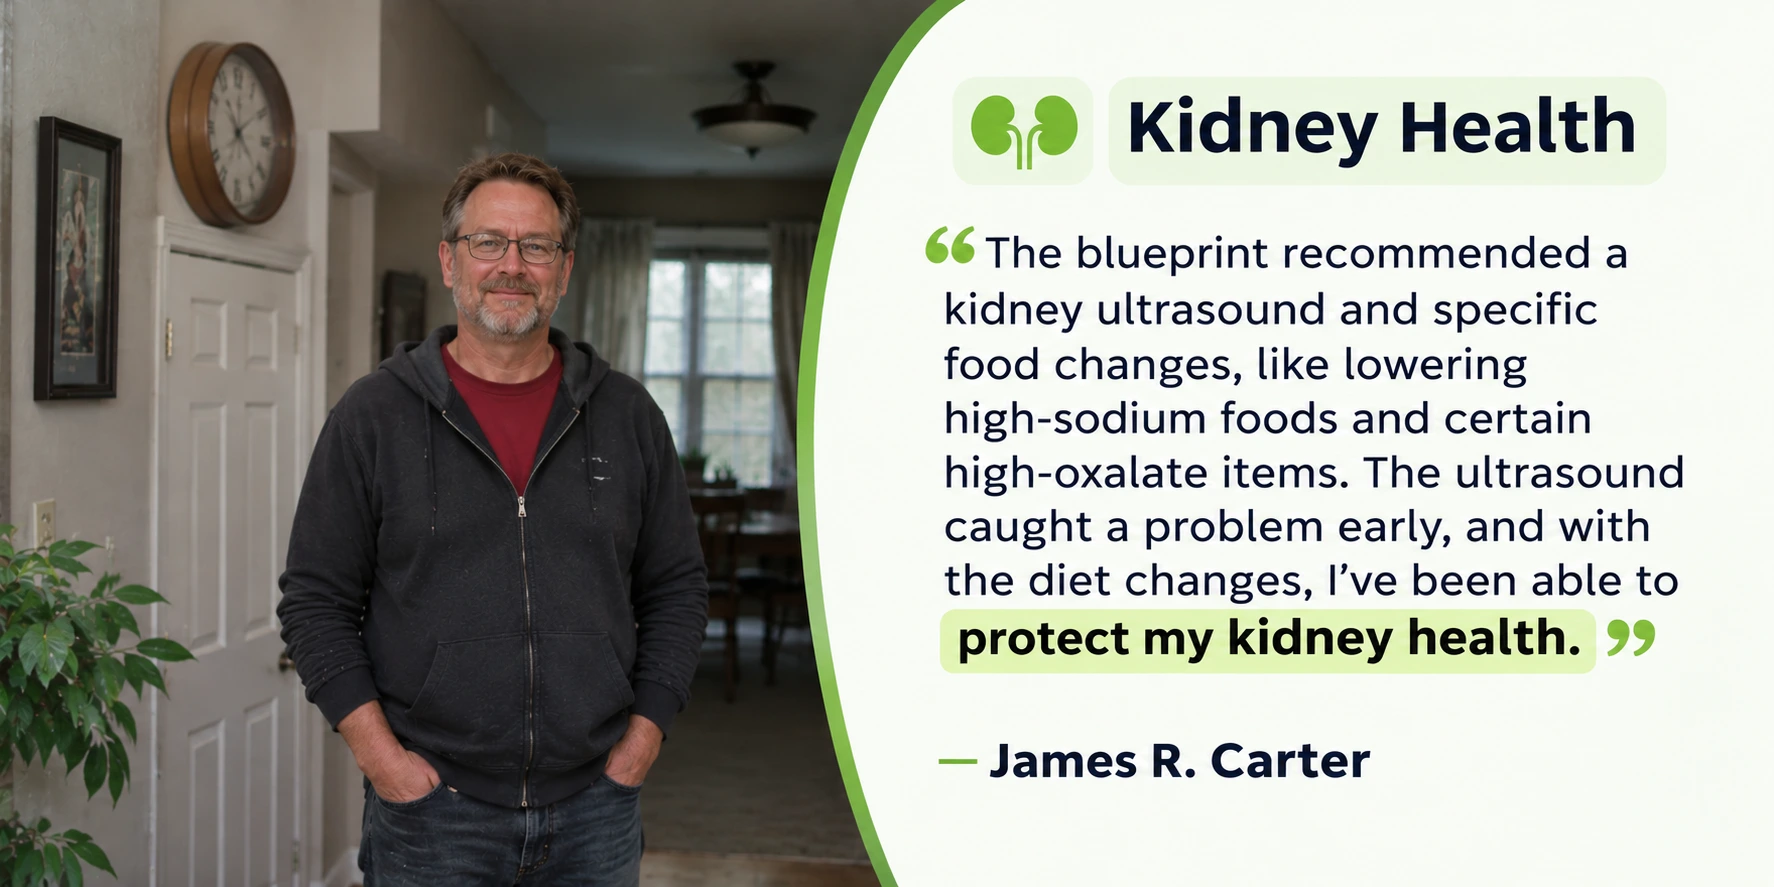
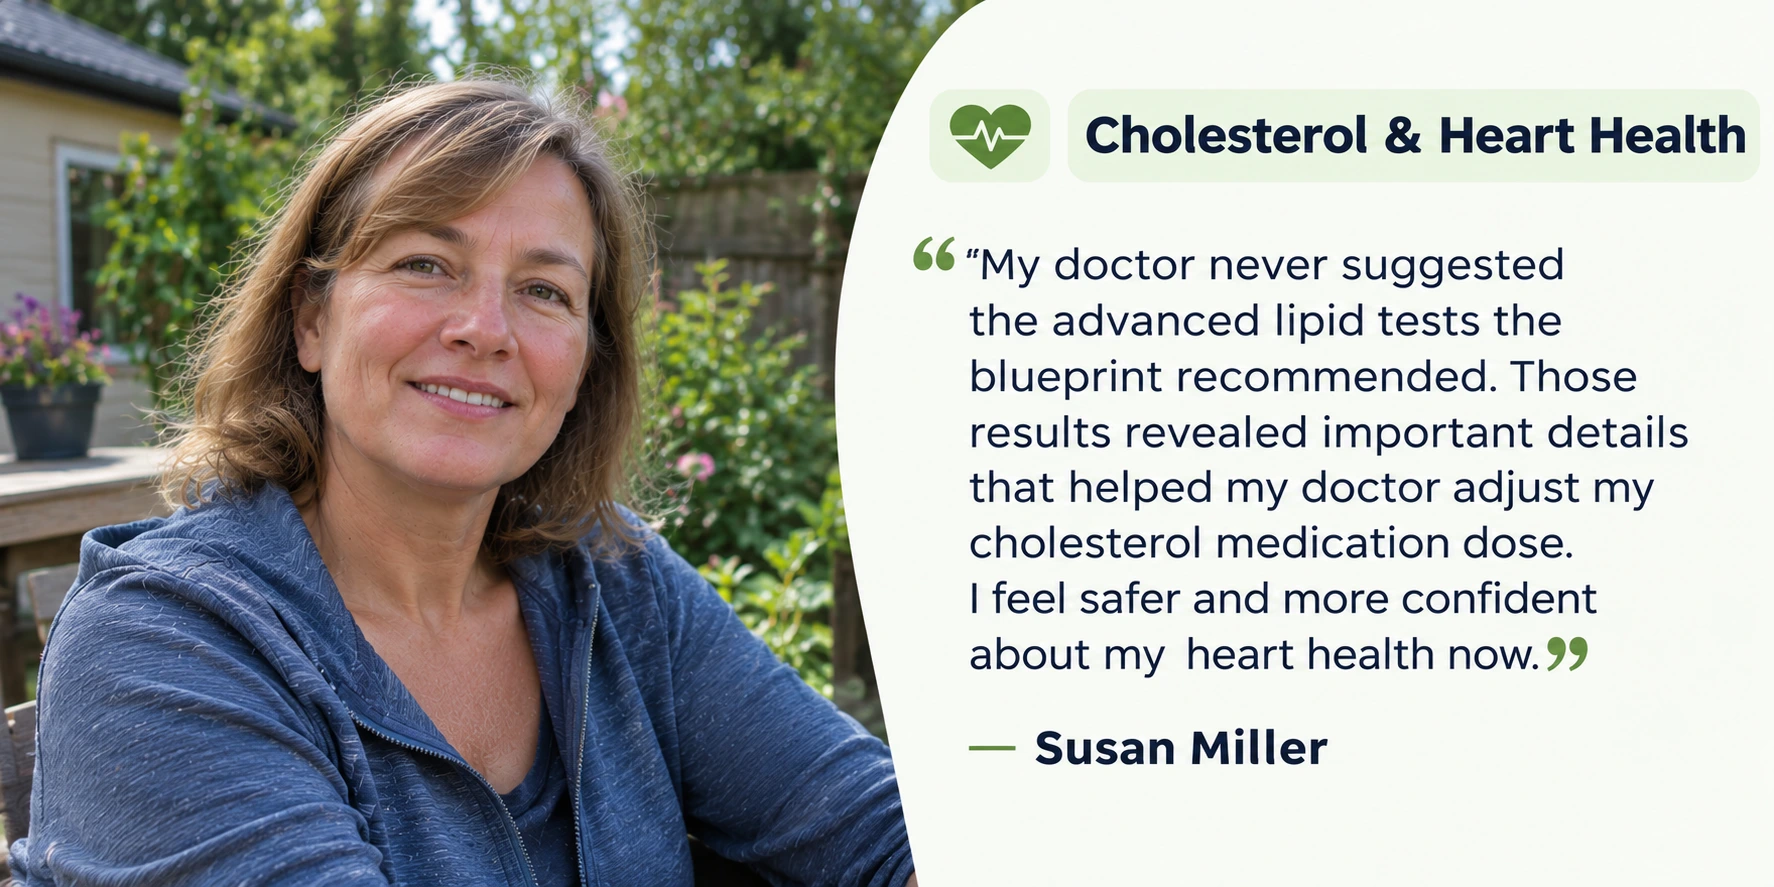
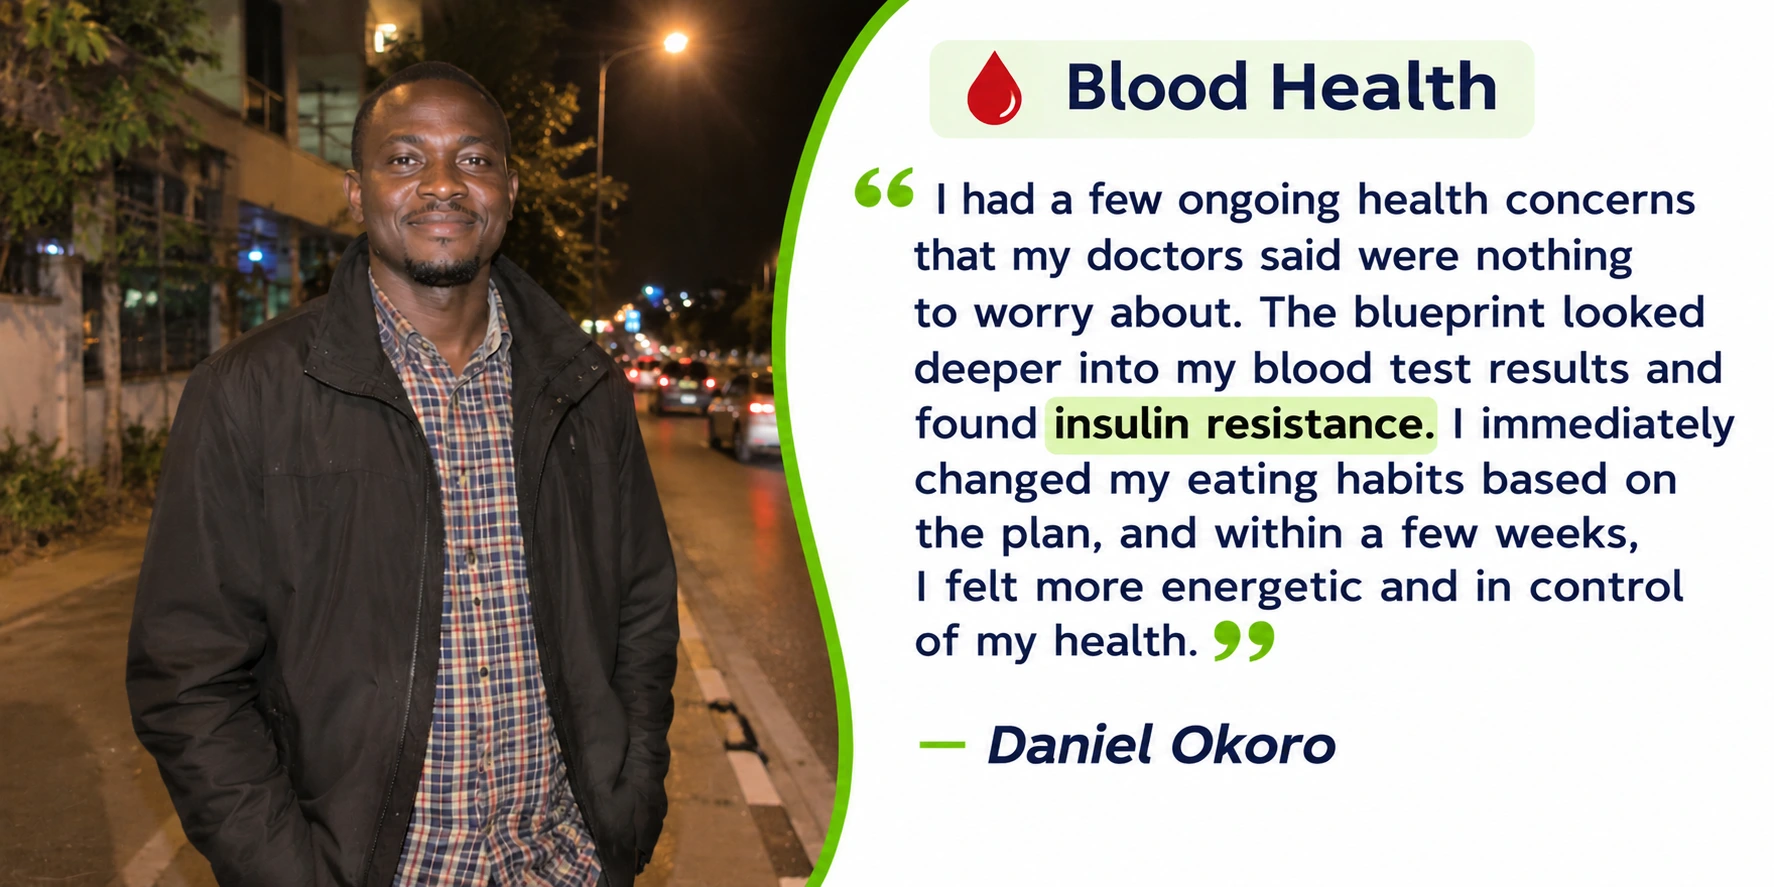
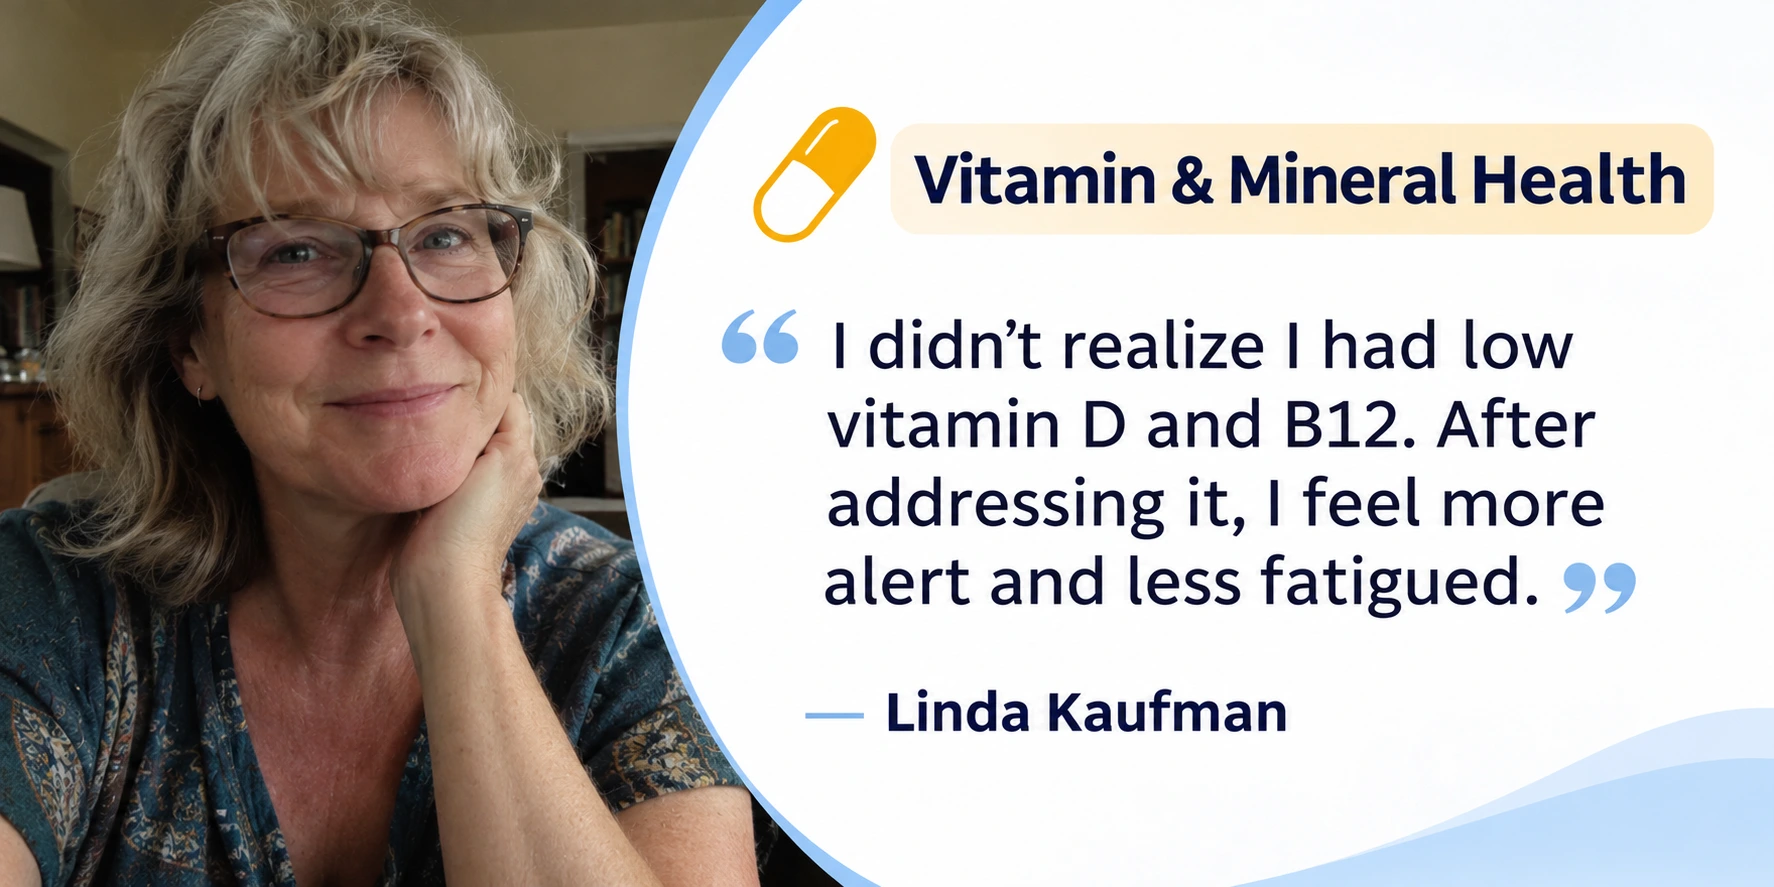
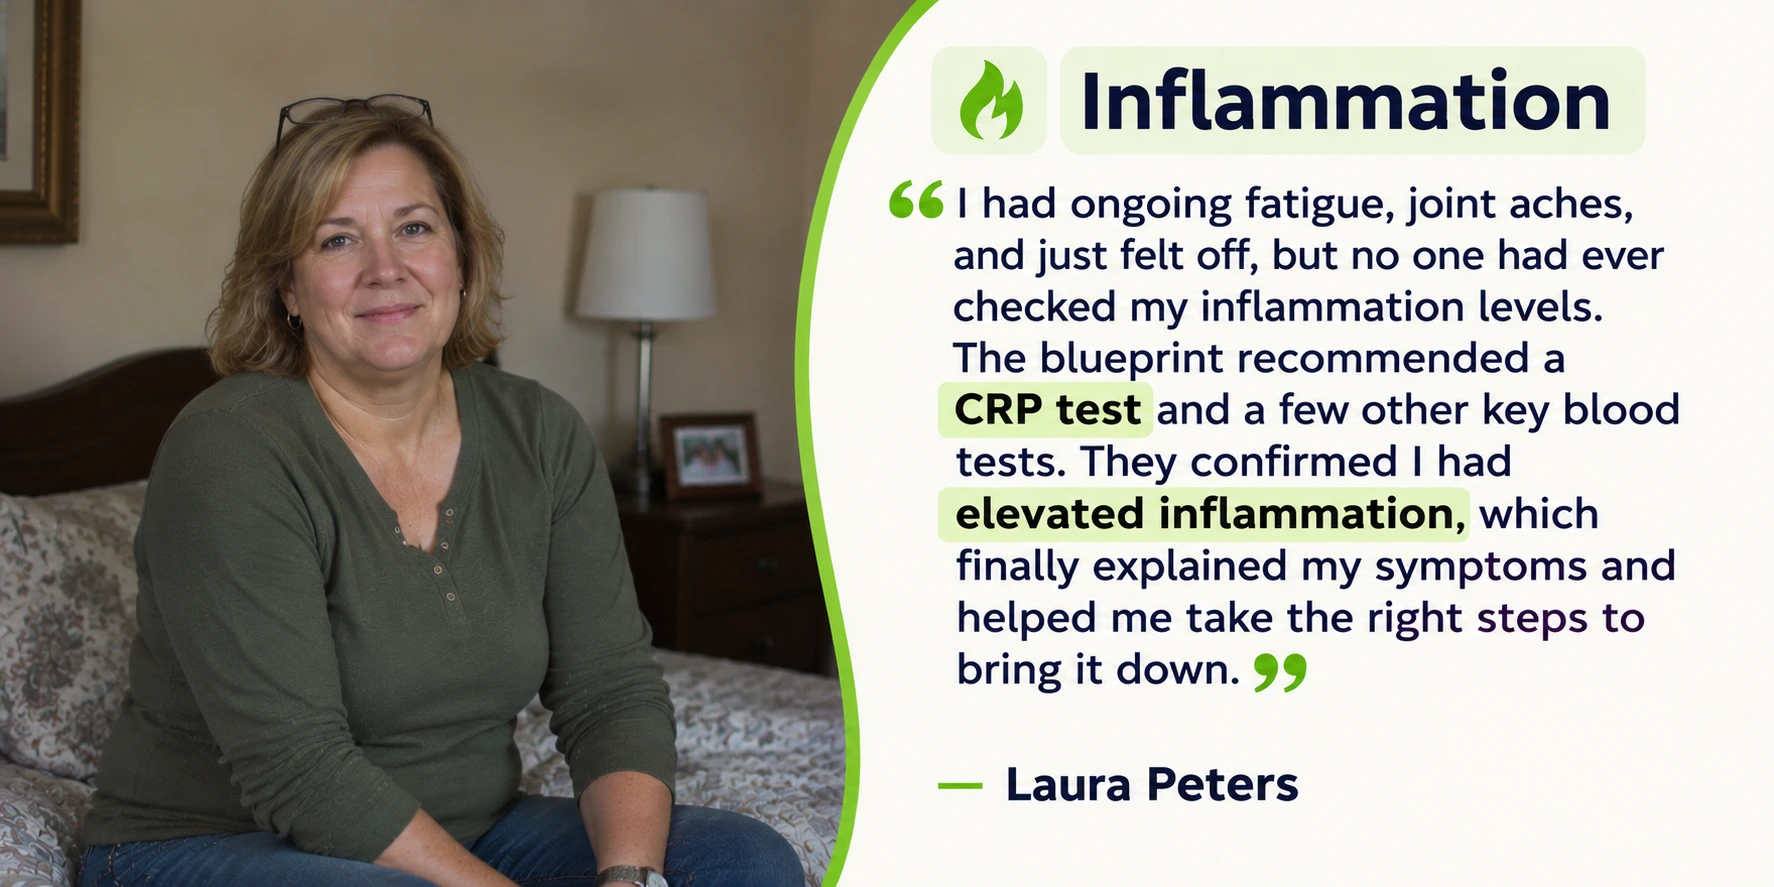
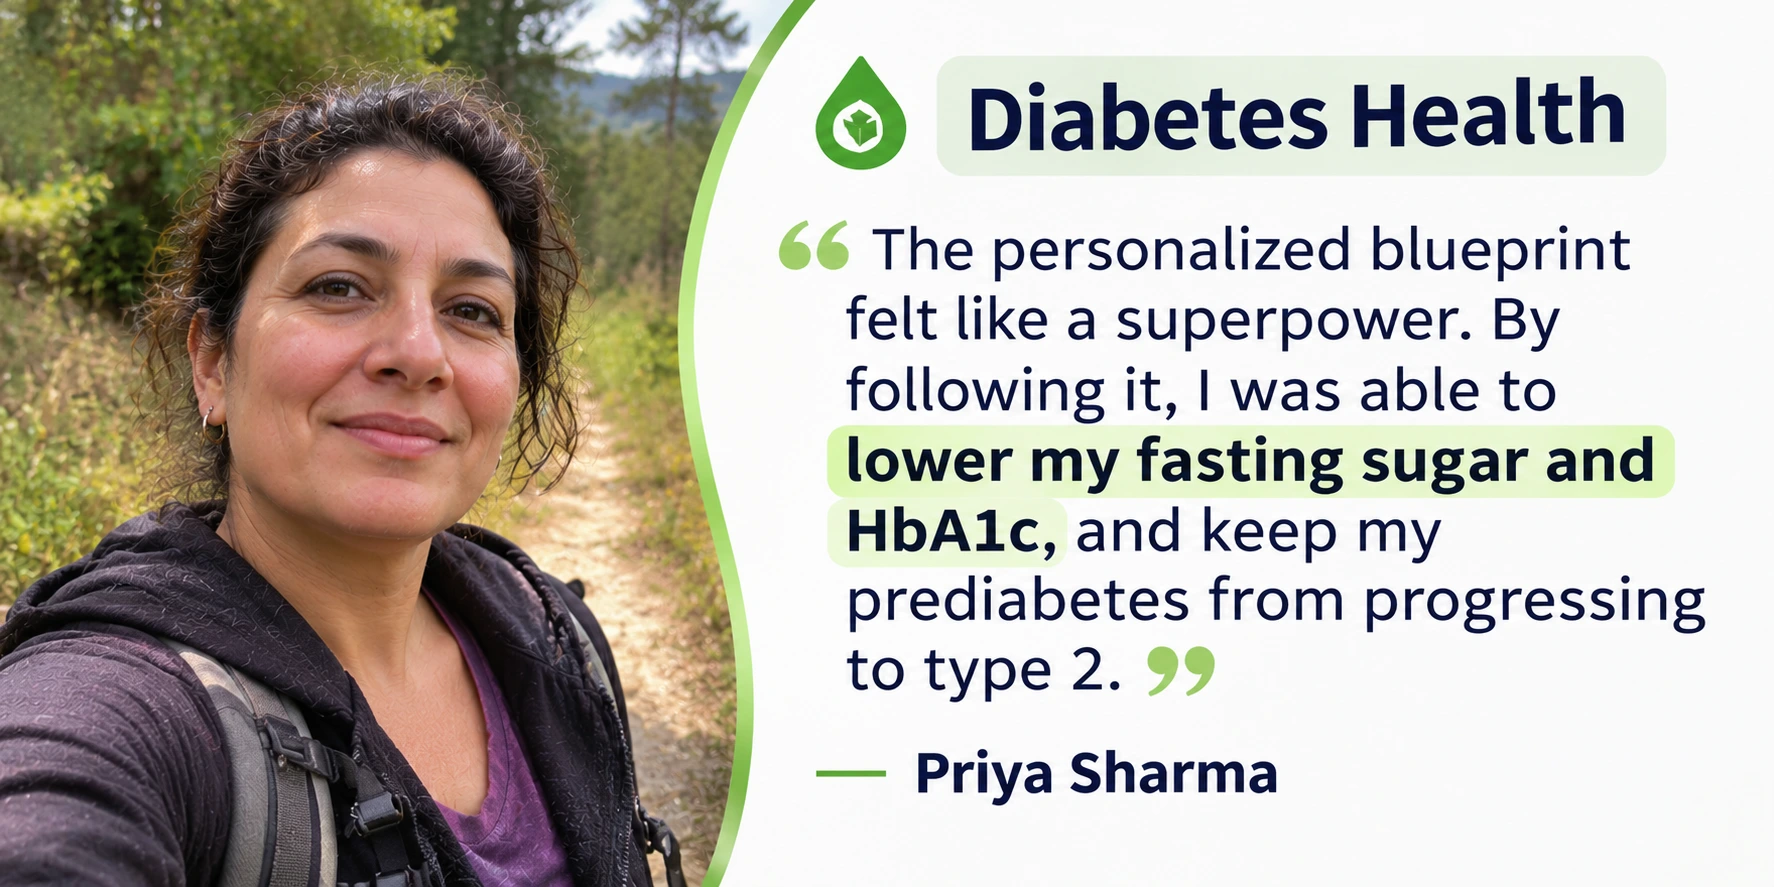
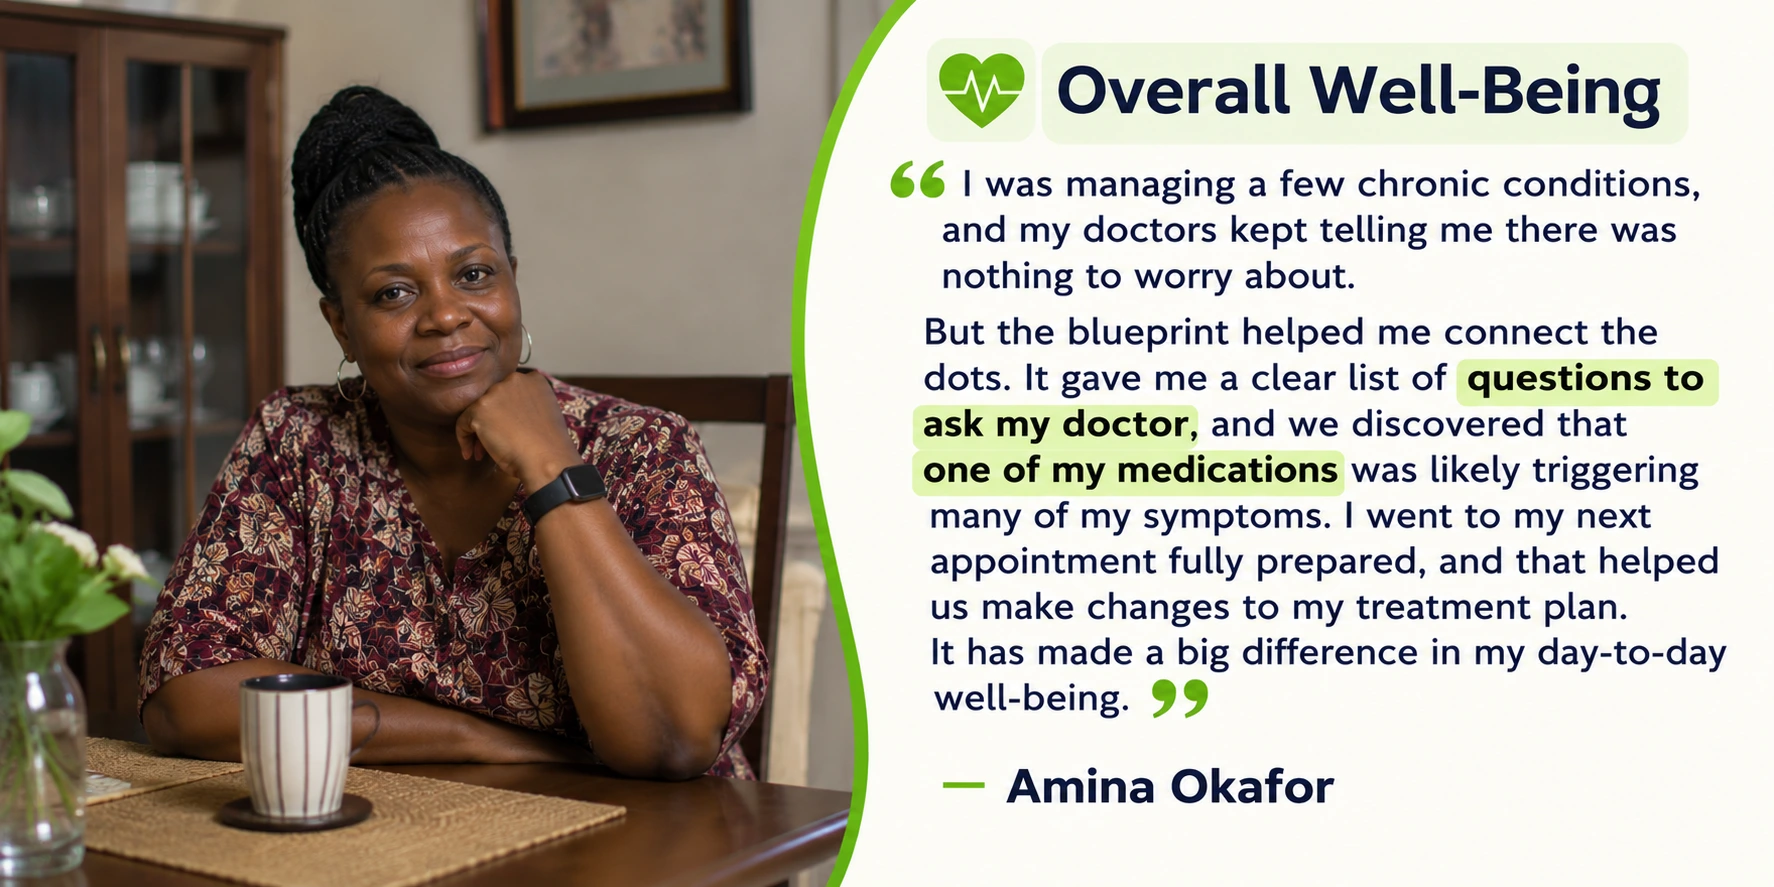
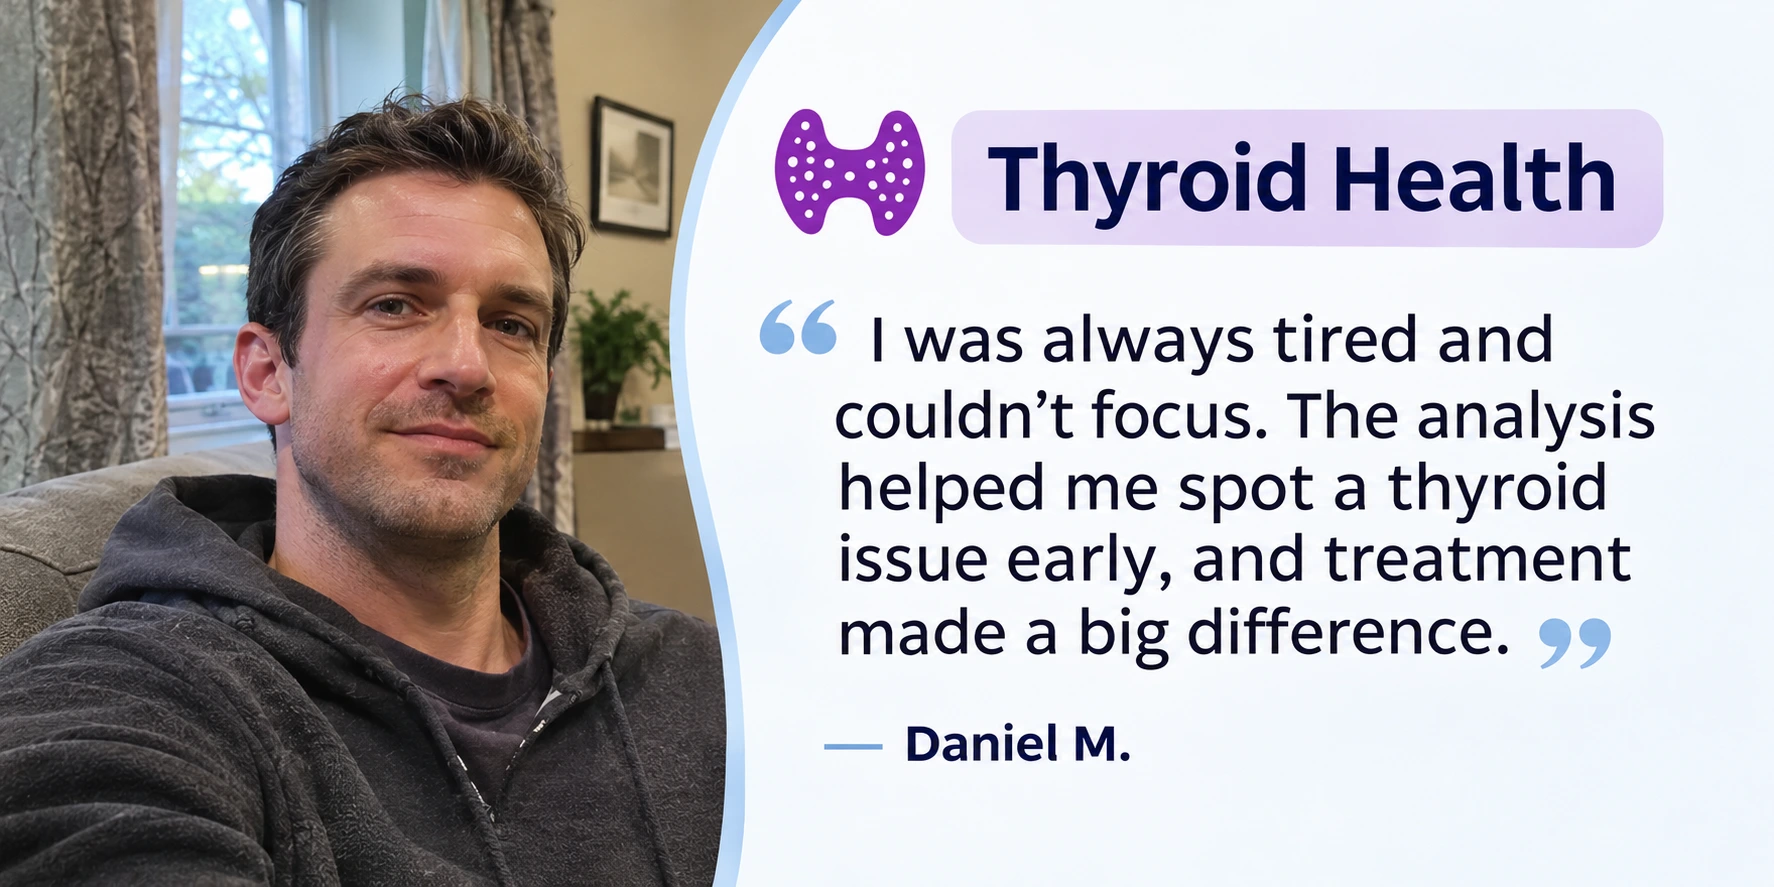
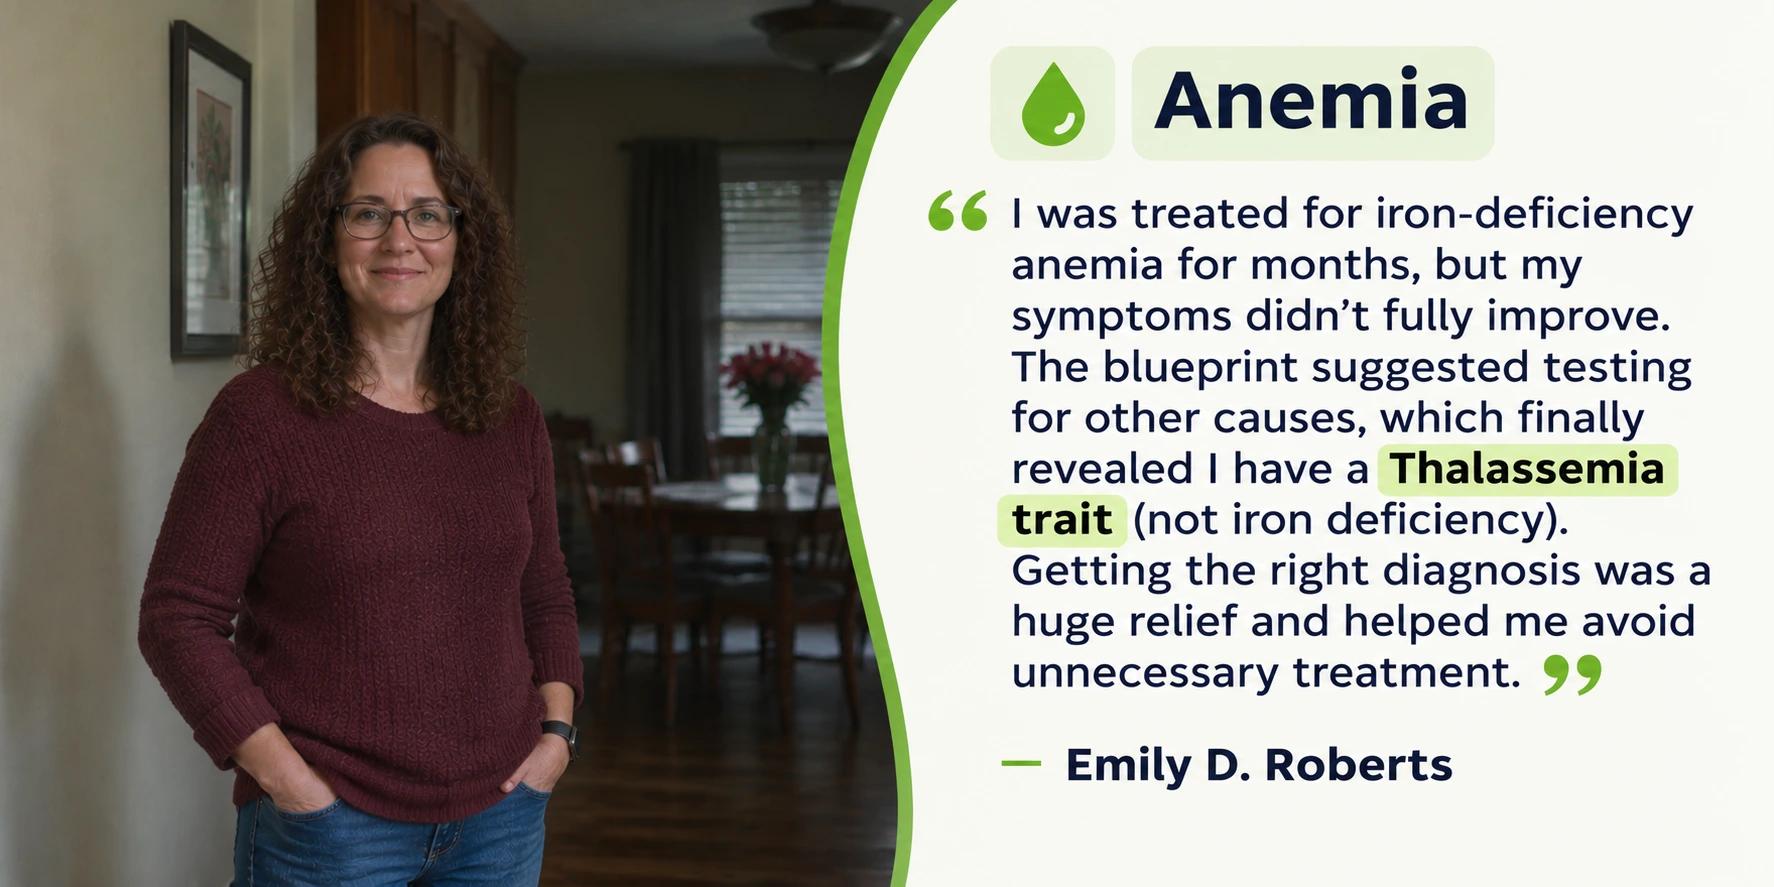
Notes from people who wanted a clearer reading of their results.
Your blueprint will be generated from the numbers you entered.
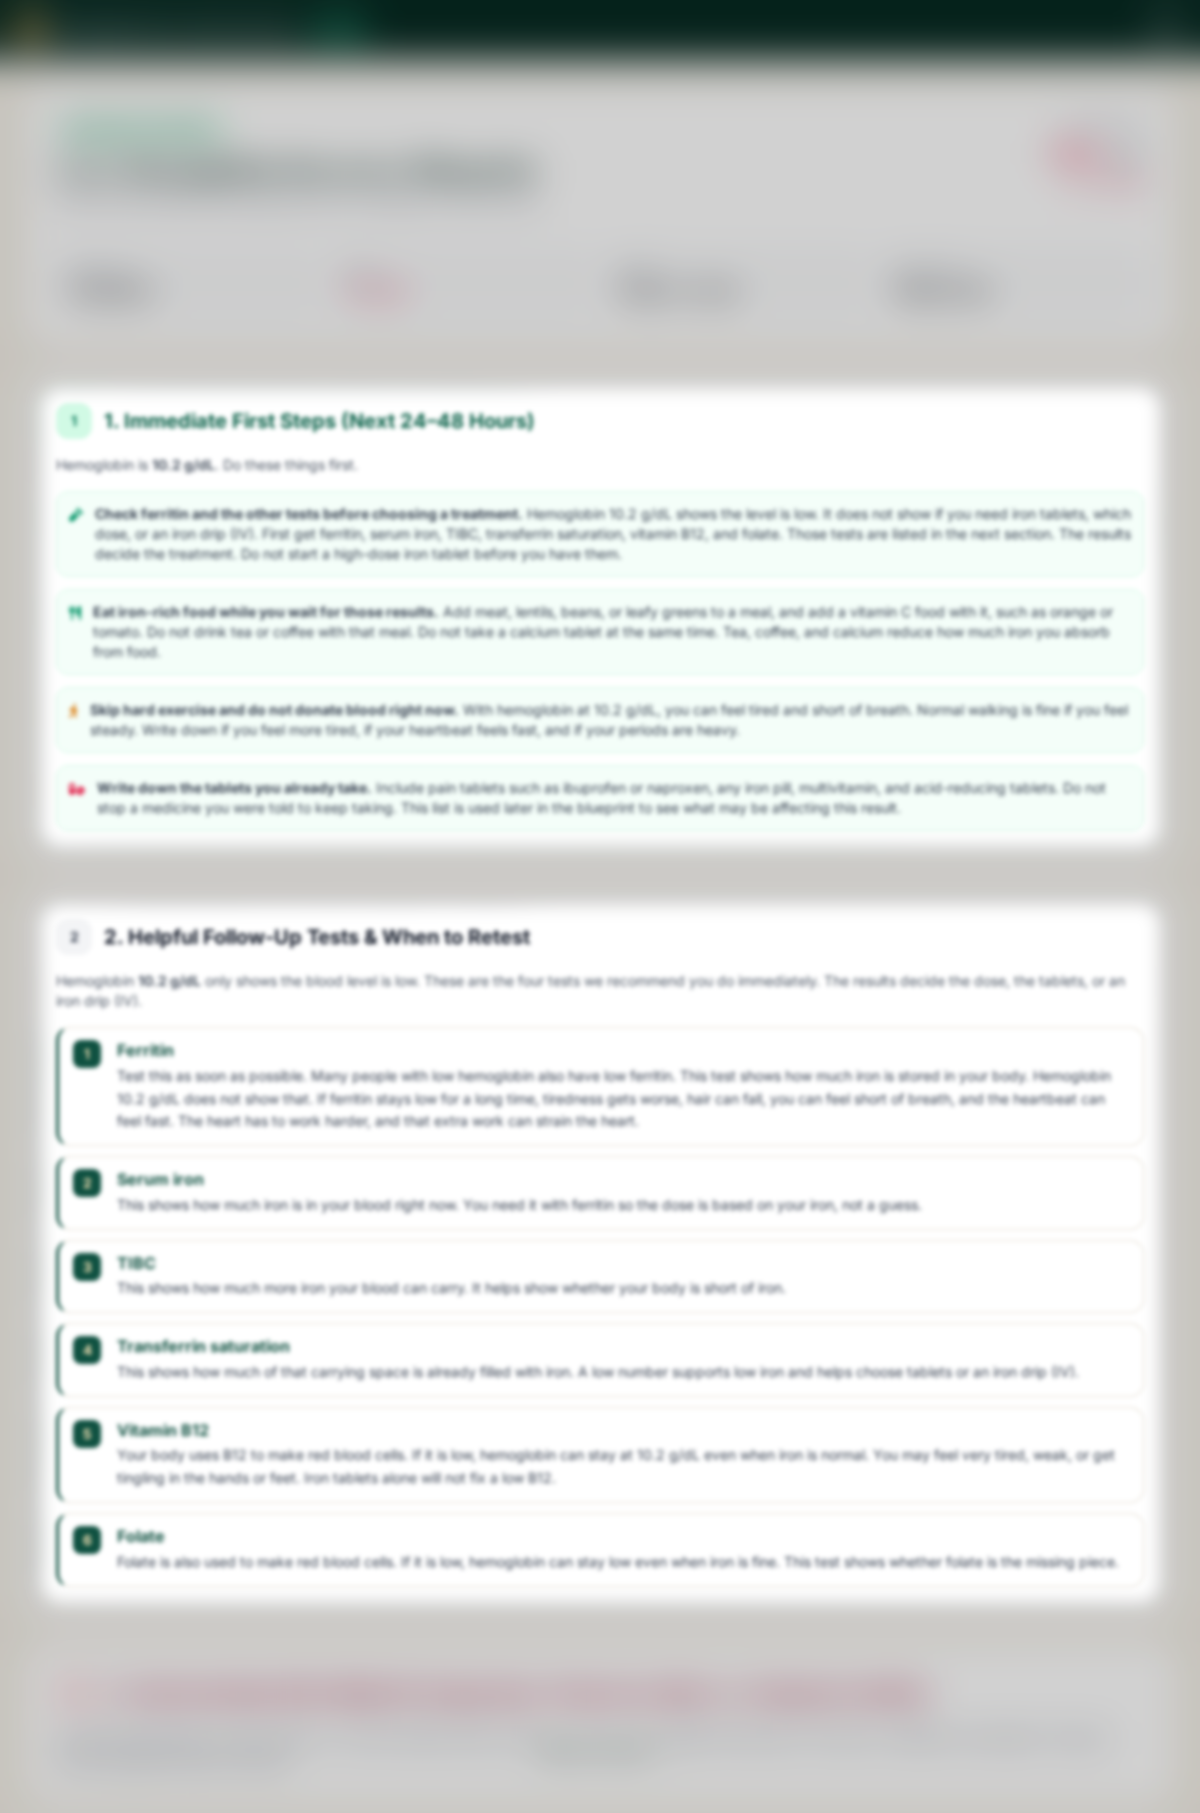
This shows the 16-part structure. Your blueprint will be generated from your numbers.
Hemoglobin is 10.2 g/dL. Do these things first.
Hemoglobin 10.2 g/dL only shows the blood level is low. These are the four tests we recommend you do immediately. The results decide the dose, the tablets, or an iron drip (IV).
Ferritin
Test this as soon as possible. Many people with low hemoglobin also have low ferritin. This test shows how much iron is stored in your body. Hemoglobin 10.2 g/dL does not show that. If ferritin stays low for a long time, tiredness gets worse, hair can fall, you can feel short of breath, and the heartbeat can feel fast. The heart has to work harder, and that extra work can strain the heart.
Serum iron
This shows how much iron is in your blood right now. You need it with ferritin so the dose is based on your iron, not a guess.
TIBC
This shows how much more iron your blood can carry. It helps show whether your body is short of iron.
Transferrin saturation
This shows how much of that carrying space is already filled with iron. A low number supports low iron and helps choose tablets or an iron drip (IV).
Vitamin B12
Your body uses B12 to make red blood cells. If it is low, hemoglobin can stay at 10.2 g/dL even when iron is normal. You may feel very tired, weak, or get tingling in the hands or feet. Iron tablets alone will not fix a low B12.
Folate
Folate is also used to make red blood cells. If it is low, hemoglobin can stay low even when iron is fine. This test shows whether folate is the missing piece.
A short dip after illness, a heavy period, or a recent donation often moves on a repeat. A hemoglobin that stays at 10.2 g/dL is a different conversation. The paid section separates those two stories.
Meals that carry iron, drinks to keep away from those meals, and what not to stack with calcium. Written around 10.2 g/dL. Any diet change still goes through your own doctor.
Questions on periods, black stools, diet, and which of the tests above are already done. One page you can hand over. Not a visit booked with us.
Usual adult ranges, and why a flag on a portal is not the same as a decision. How 10.2 compares for a 46-year-old woman.
Fatigue and looking pale, read next to 10.2 g/dL. When the visit should not wait. Education, not a clinic score.
Iron forms and companion nutrients that research has explored. Evidence, not a tablet to start tonight, and not a dose.
Acid reducers, some pain tablets, and a few everyday products that change absorption or blood loss. The page says what to ask. It does not say to stop a prescription.
What people often notice over the following weeks if the reason for 10.2 g/dL is found. A calendar, not a promise the number will land on a specific figure.
Chest pain, fainting, breathlessness that is getting worse quickly, or black stools. The full list sits in the paid blueprint.
Energy, stairs, and how heavy periods are, so the next visit is not from memory.
Is 10.2 an emergency? Can I still work? Should I donate blood? Plain answers for this sample reading.
Low iron stores, blood loss, missing building blocks, a recent illness, and a few less obvious causes. A checklist for 10.2 g/dL, not a verdict.
Signs that a meal plan is the wrong next step and a clinician should talk about further tests. This sample does not make that call.
How a hemoglobin that has come up is usually watched, and what to keep on the next lab slip so it does not slide back unnoticed.